|
|
Lets Start to Draw a SN Light Curve | Main Page |
|
|
Lets Start to Draw a SN Light Curve | Main Page |
4. To calculate and study the distance between observable and theoretical
light curves. SN 1999em and Model "mpi_R500_M9_Ni004_E7", band V. (Under
Construction).
| a) | *** Calculate automatically distance modulus of the absolute light curve for SN 1999em in band V: *** 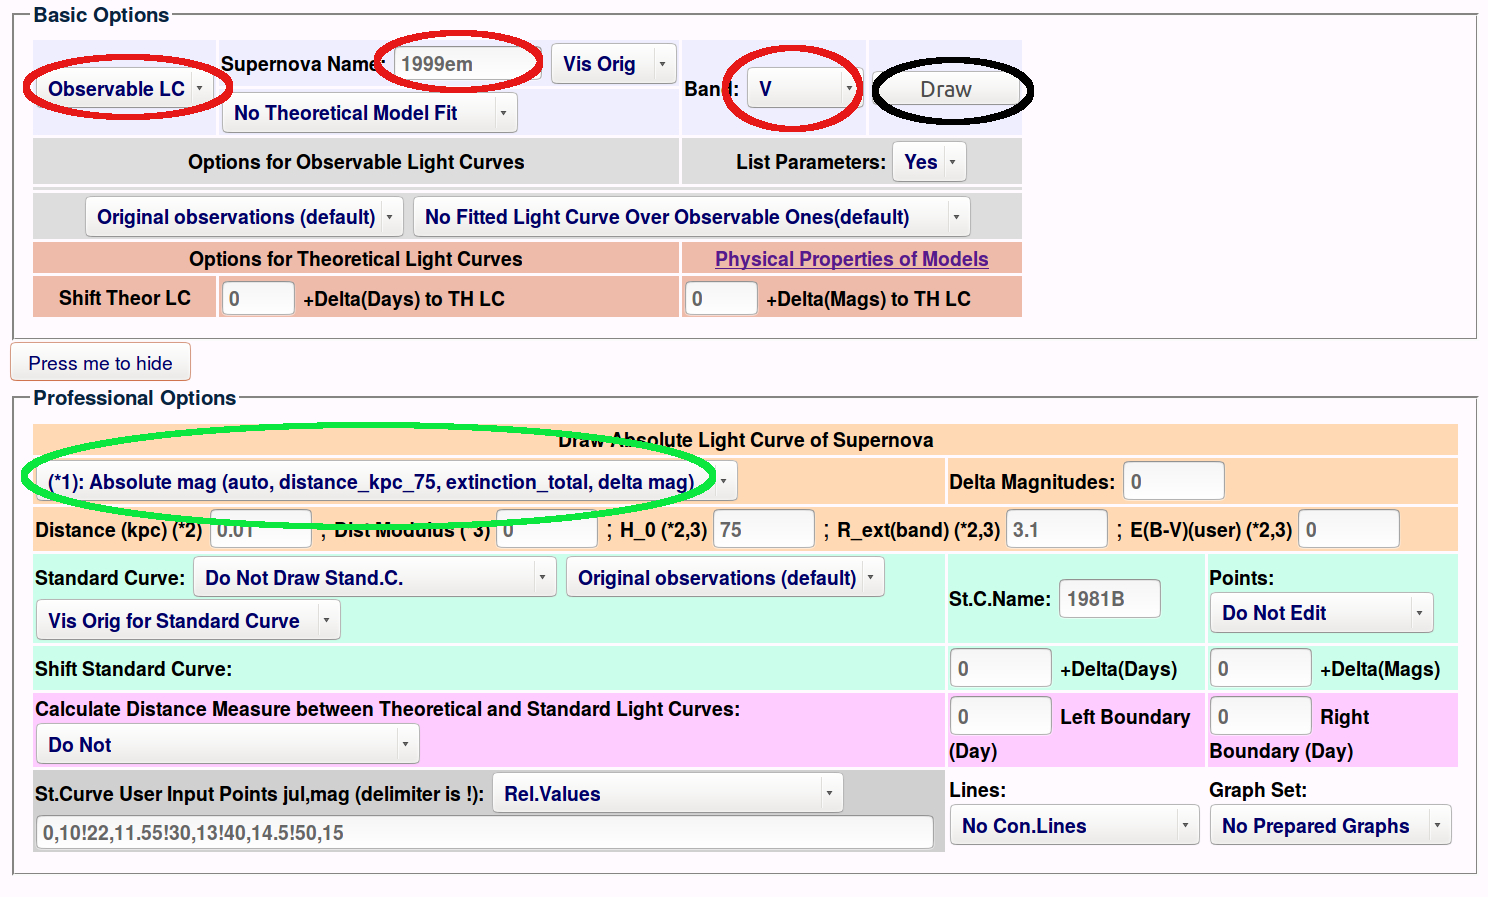 | |
| b) | *** Press "Draw" button and get the graph. Turn off amateur observations and see the curve: *** 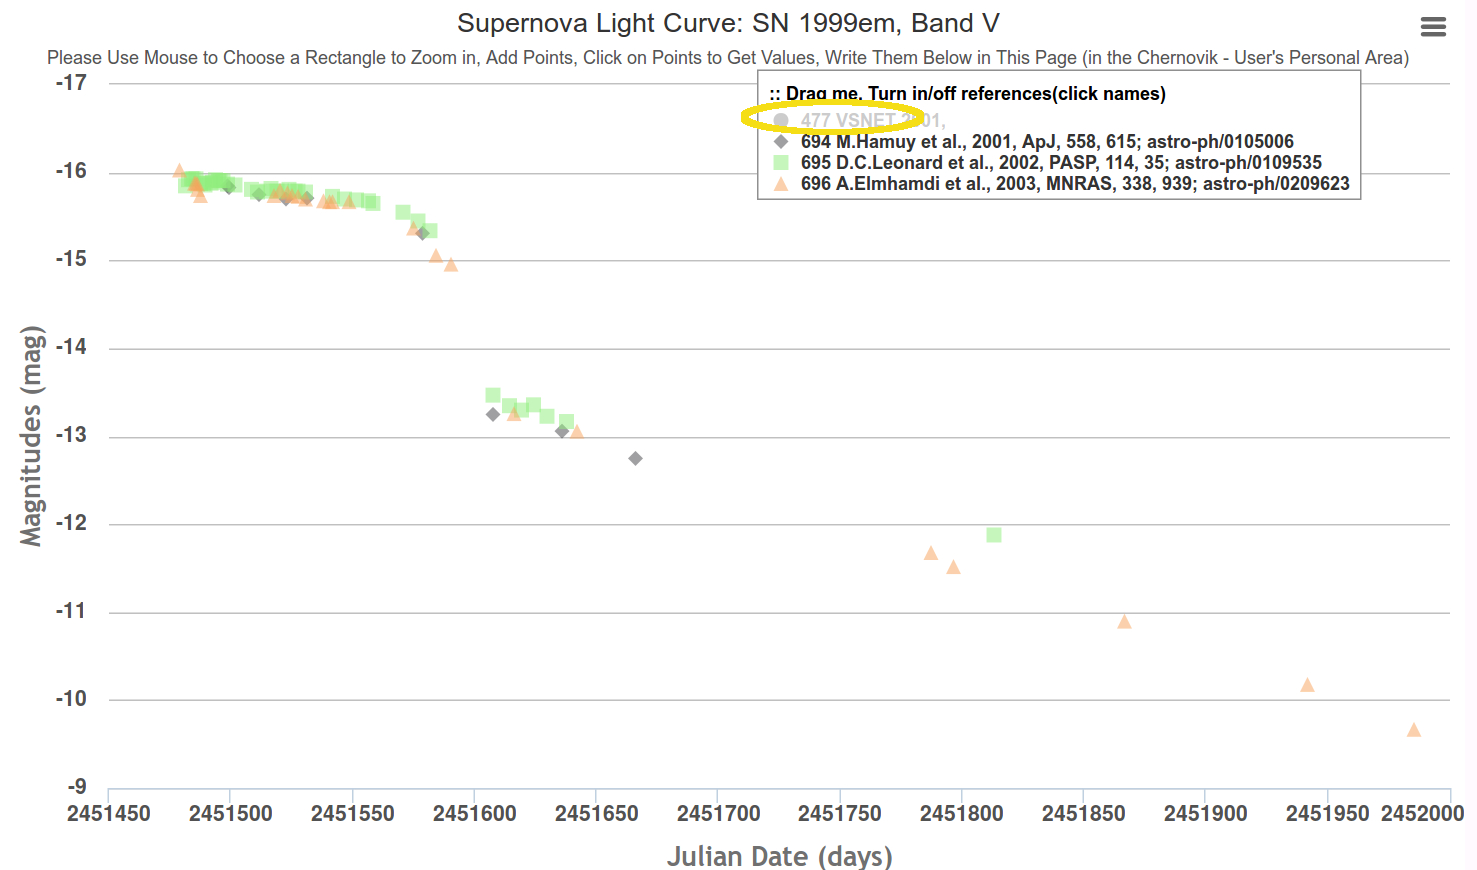 | |
| c) | *** Also see the formula of calculation below the graph. Distance modulus is the expression marked with the red ellipse: *** 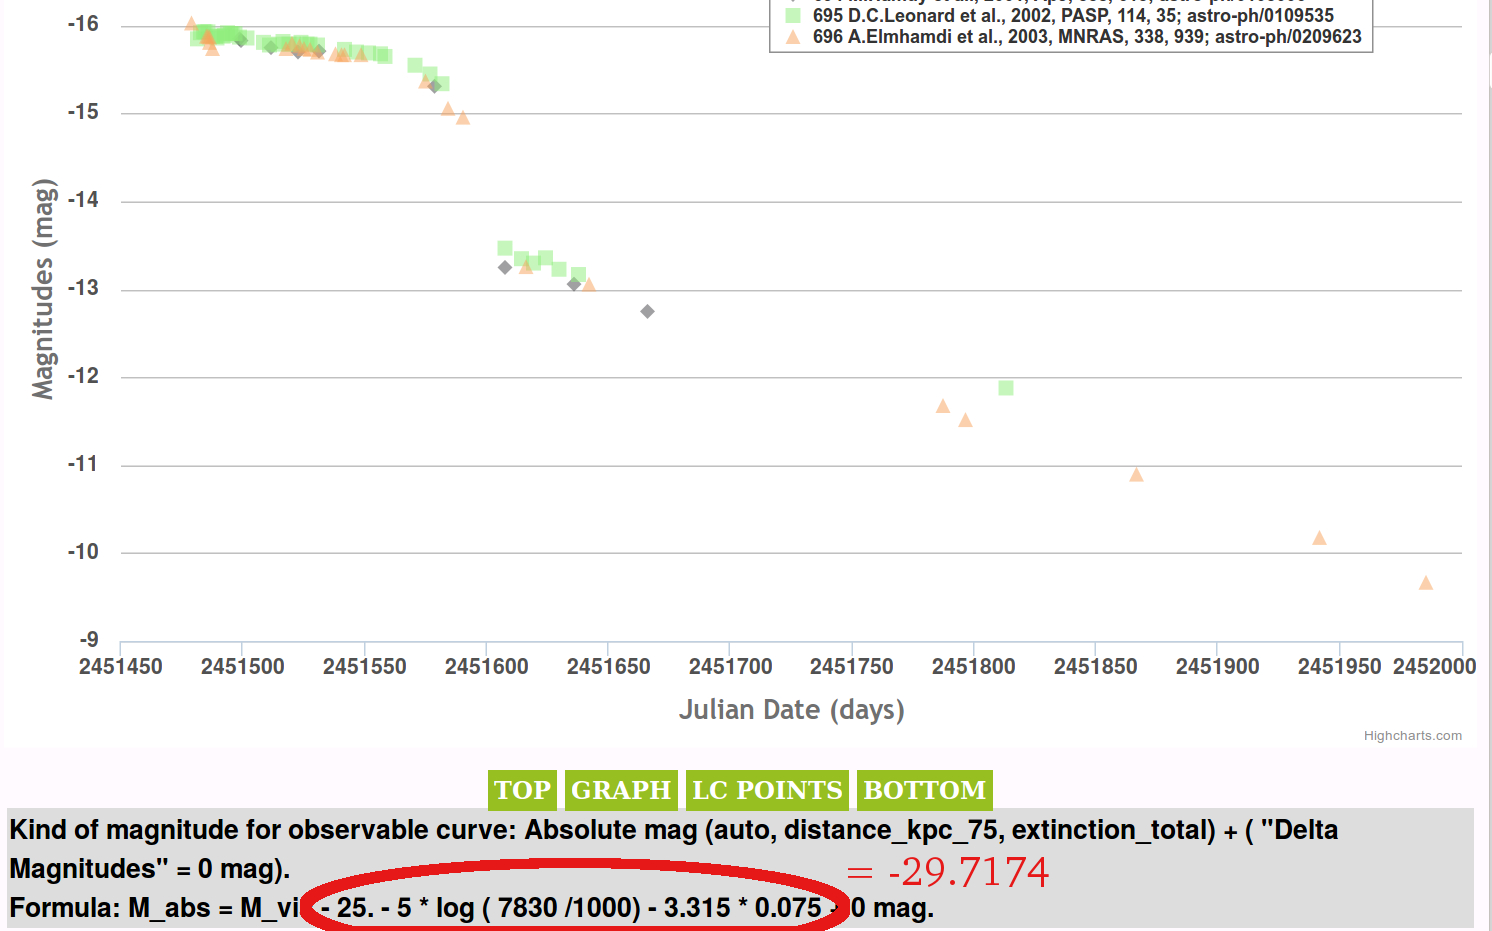 | |
| d) | *** Turn the main switch to position "Theoretical LC". Enable standart curve for SN 1999em and set it's shift on the value of distance modulus over magnitude axis: *** 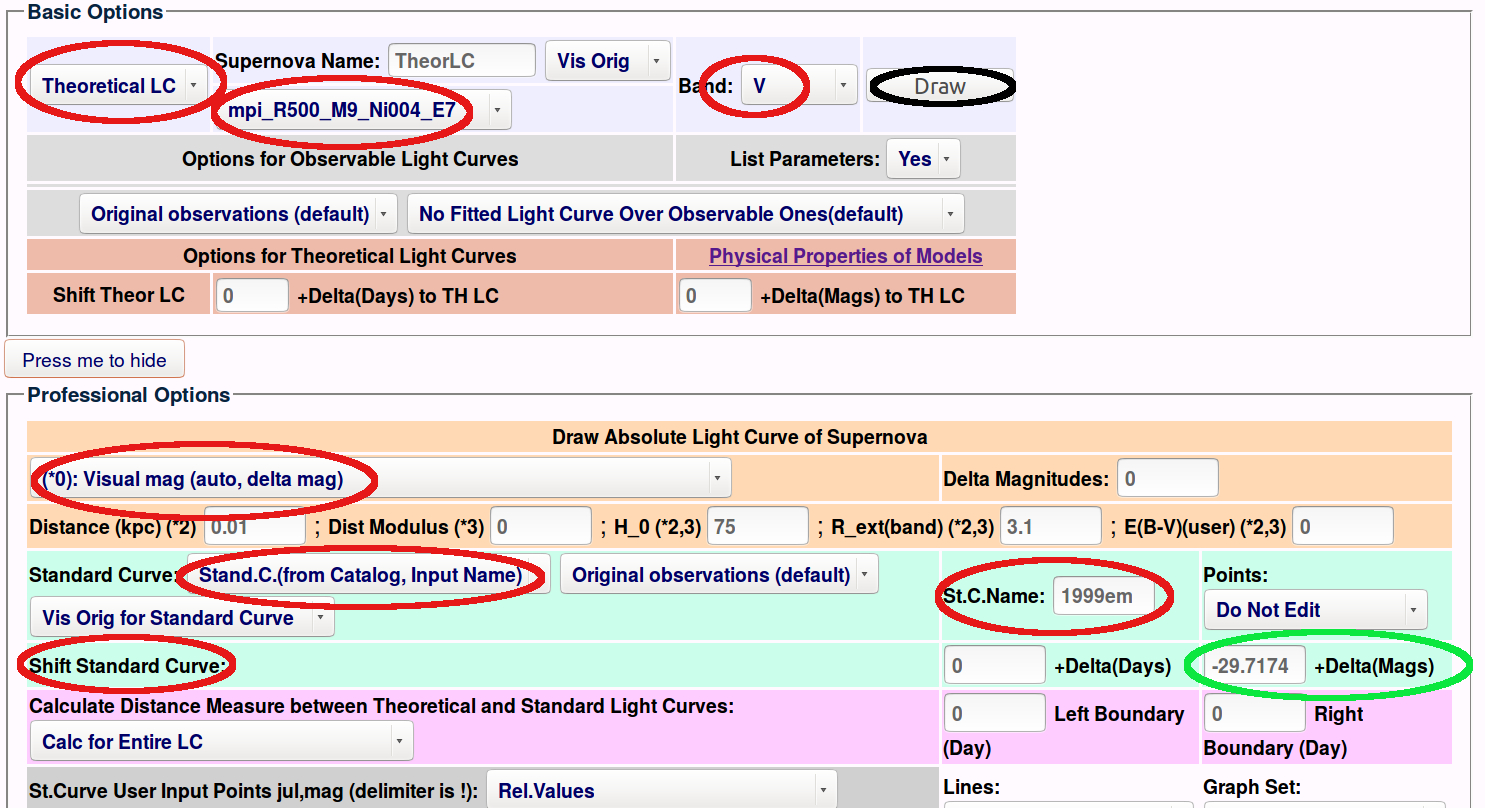 | |
| e) | *** The result is the graph: *** 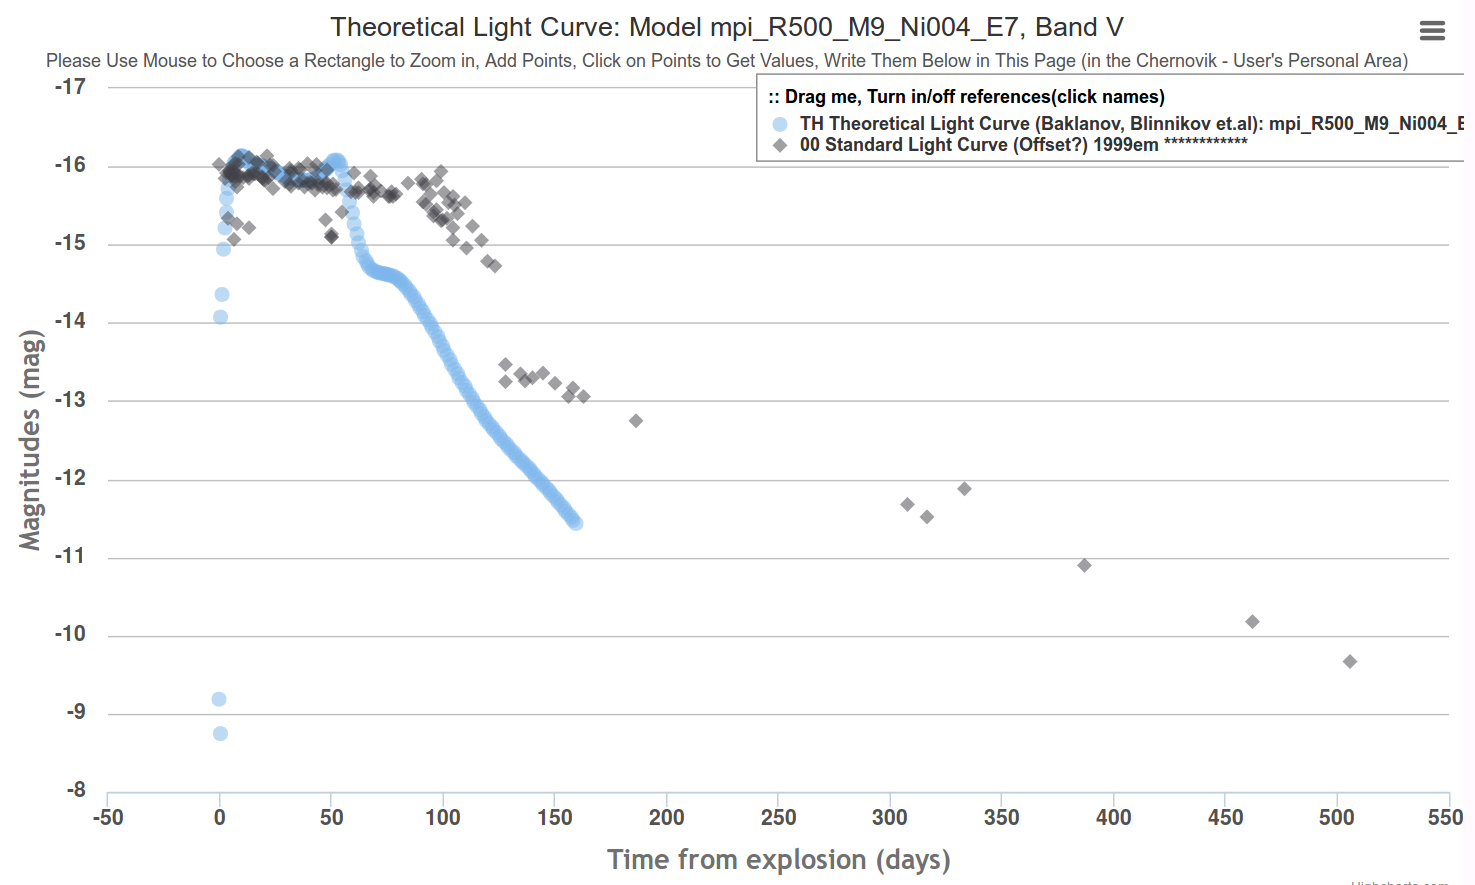 | |
| f) | *** We set distance measure between theoretical and standard light curves as the total area between them. One can calculate approximately this area, dividing the space between the curves on the quadrangles with common points on the day axis. Also one should take into account that the light curves of distinct supernovae have different time length. So it is better to calculate the area, which refers to the equal time length, say 10 days. So we also calculate the area per 10 days. *** 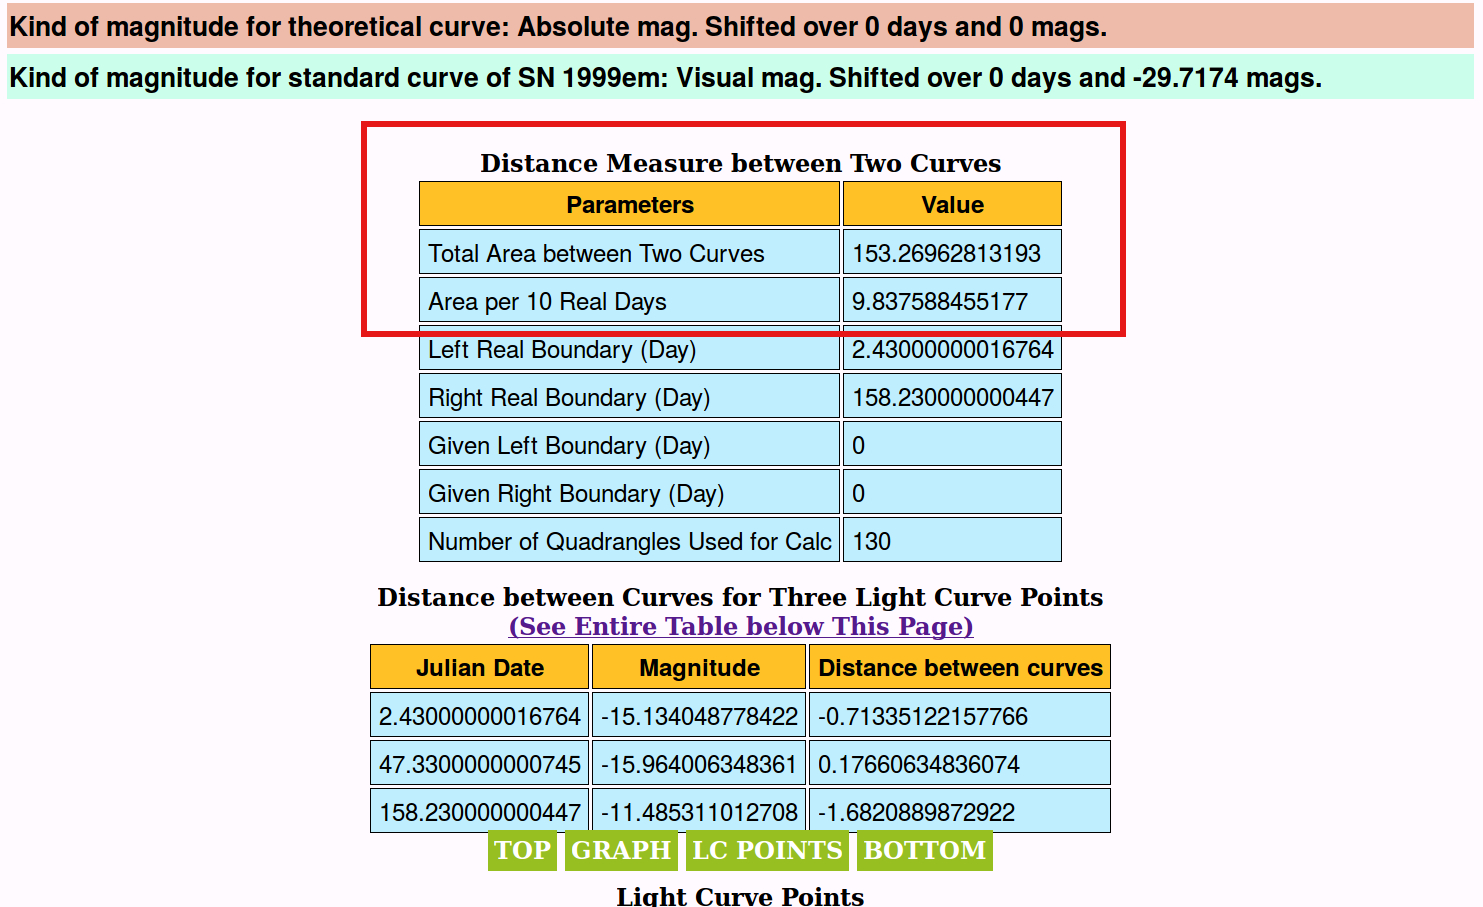 | |
| g) | *** If observations have big uncertainties and curve points have a large spread, one can use smoothed or fitted light curve instead of observational light curve. So we make standard curve from fitted light curve: *** 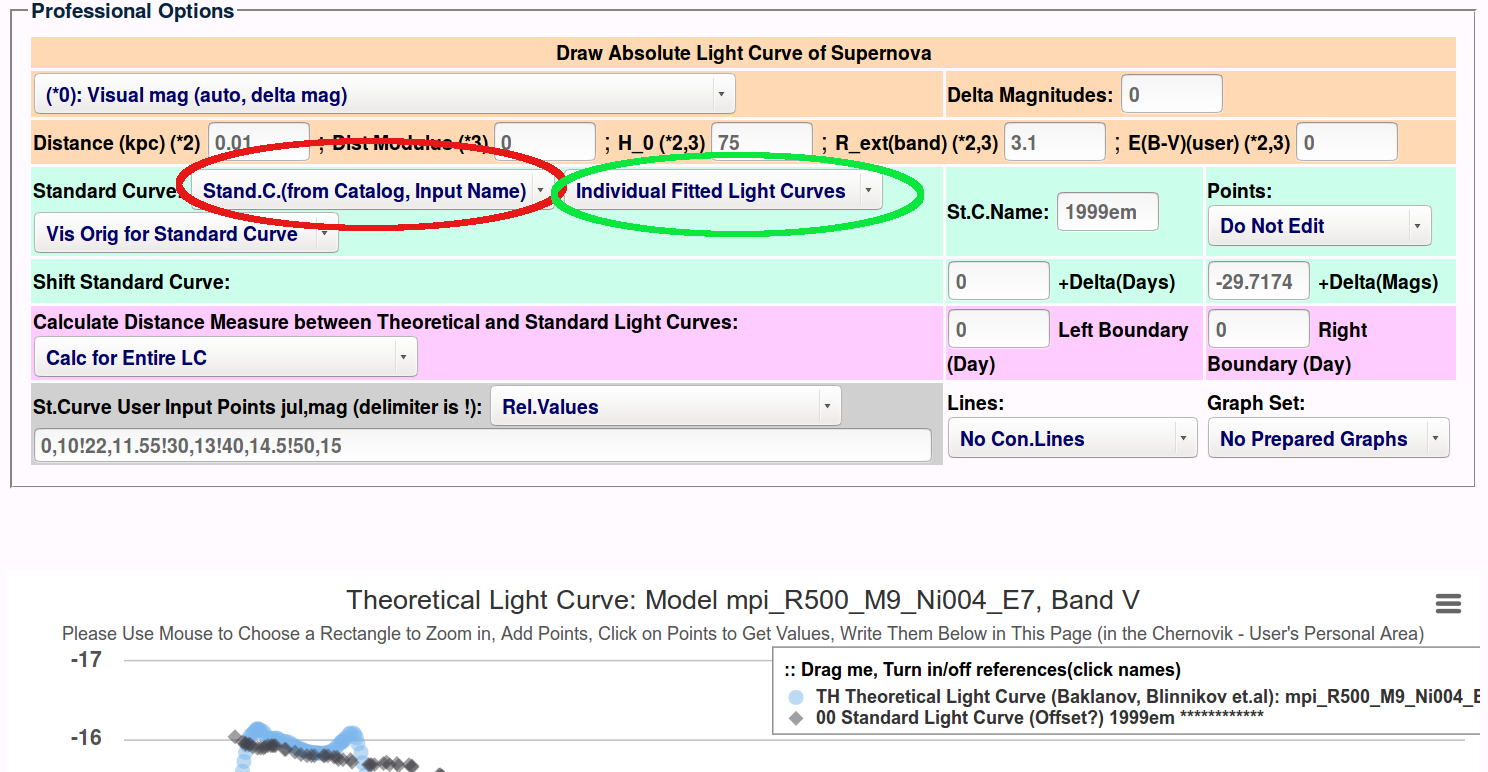 | |
| h) | *** The result is the graph: *** 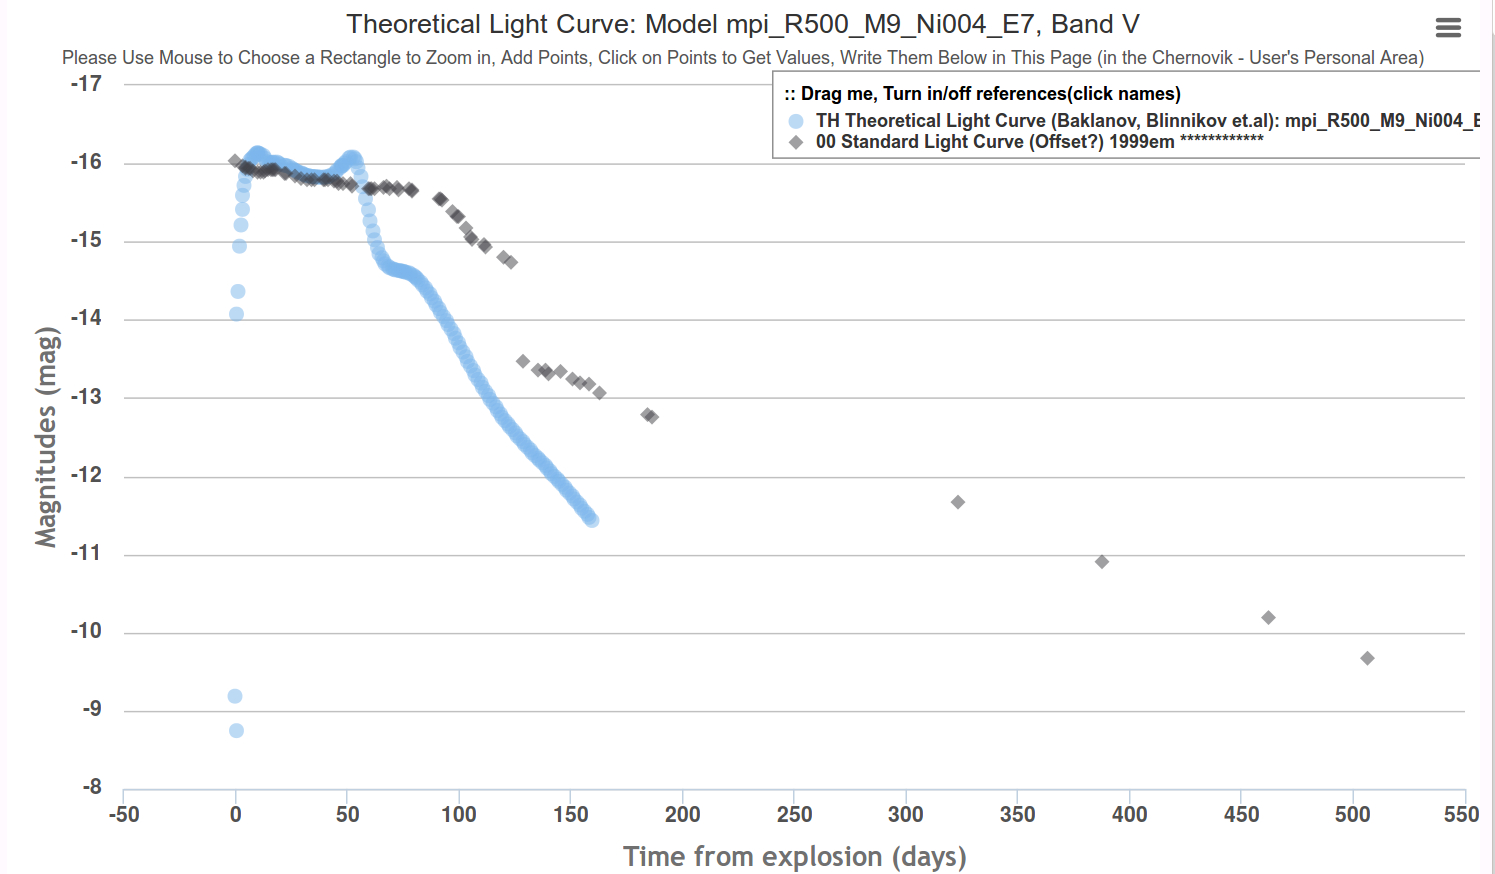 | |
| i) | *** And other values of areas: *** 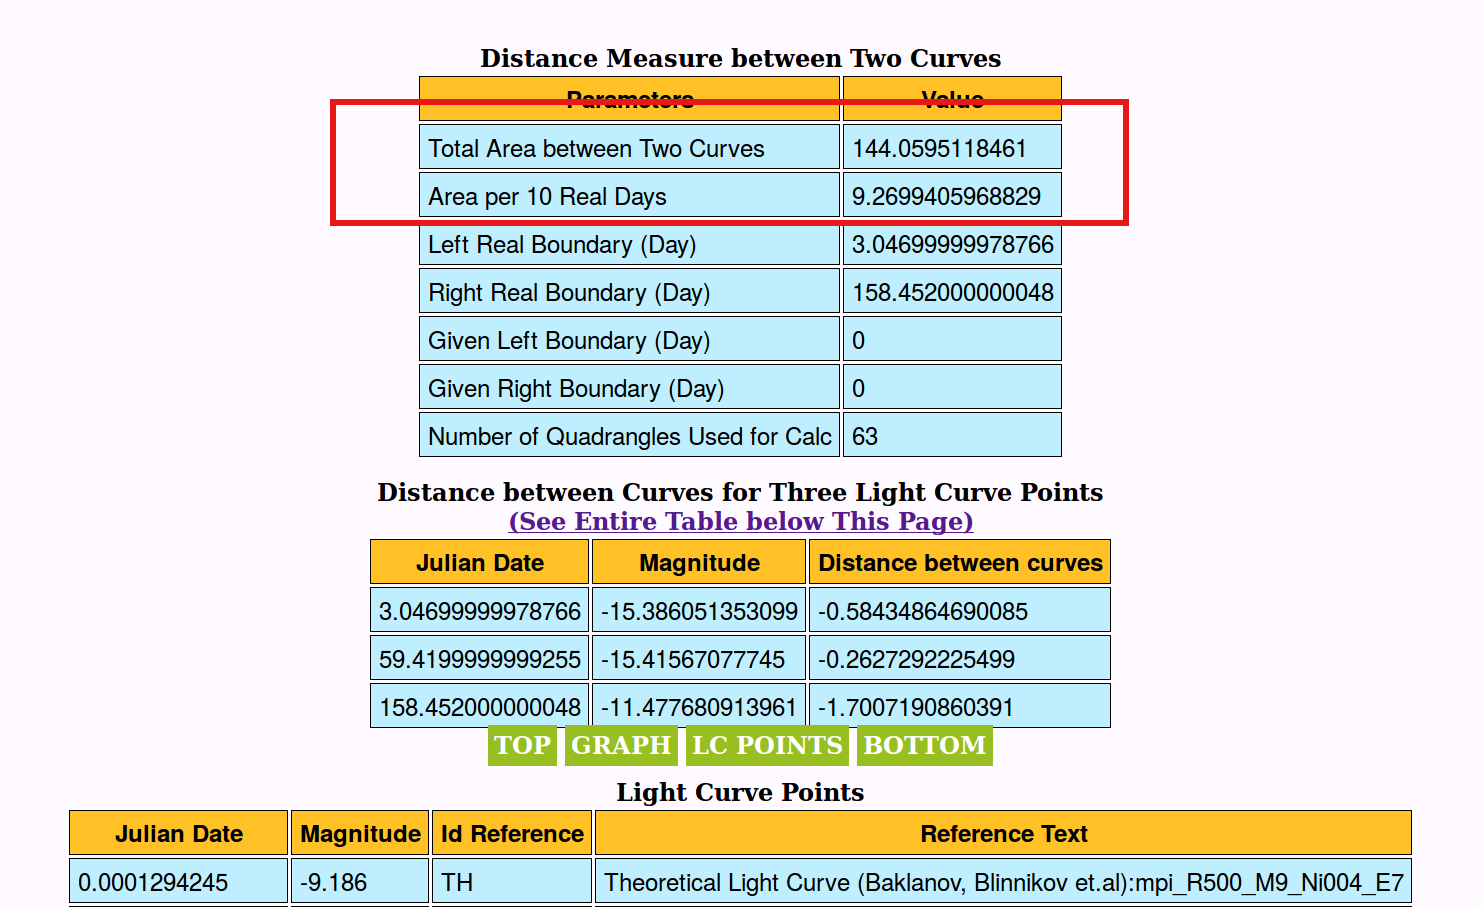 | |
| j) | *** But there is uncertainty in our calculation. While theoretical curves are calculated strictly from the moments of the explosion, the observable light curve may begin at any time after those moments. If the time of explosion is unknown for SN, one possible exit from difficult situation is to use light curve peak points which present on both curves. So we find the values of julian day and magnitude at the peak in the corresponding table. 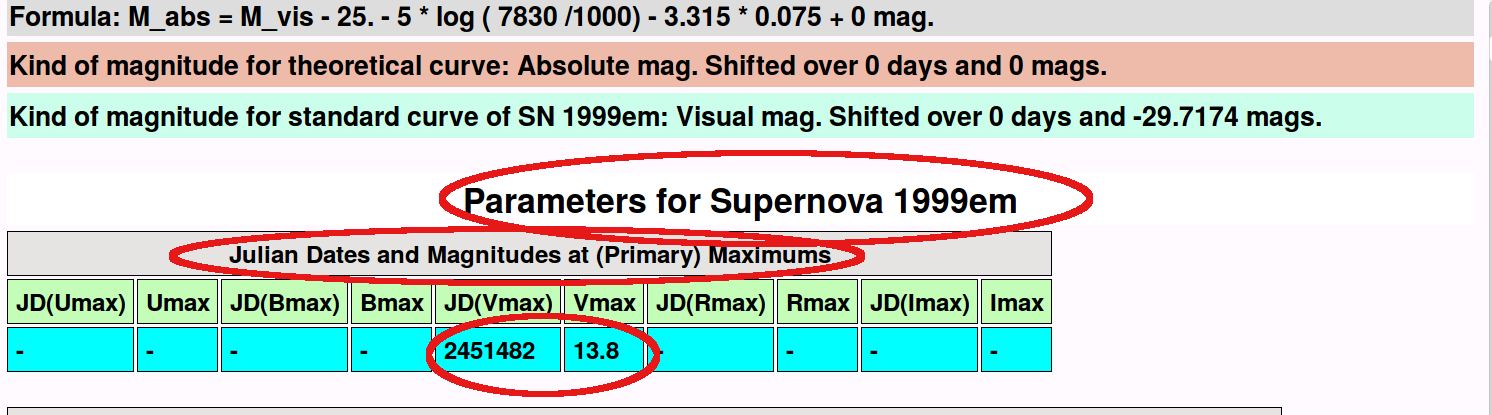 | |
| k) | *** One can see this peak point on the graph of observational light curve: *** 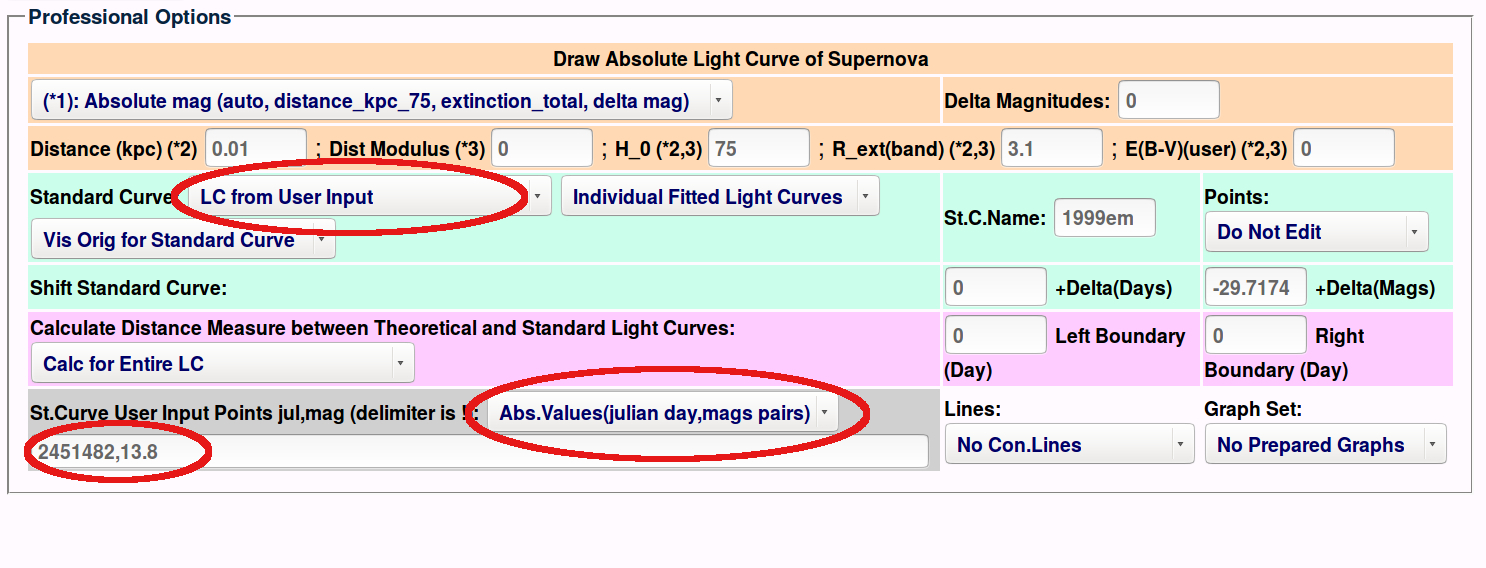 | |
| l) | *** The result is the graph: *** 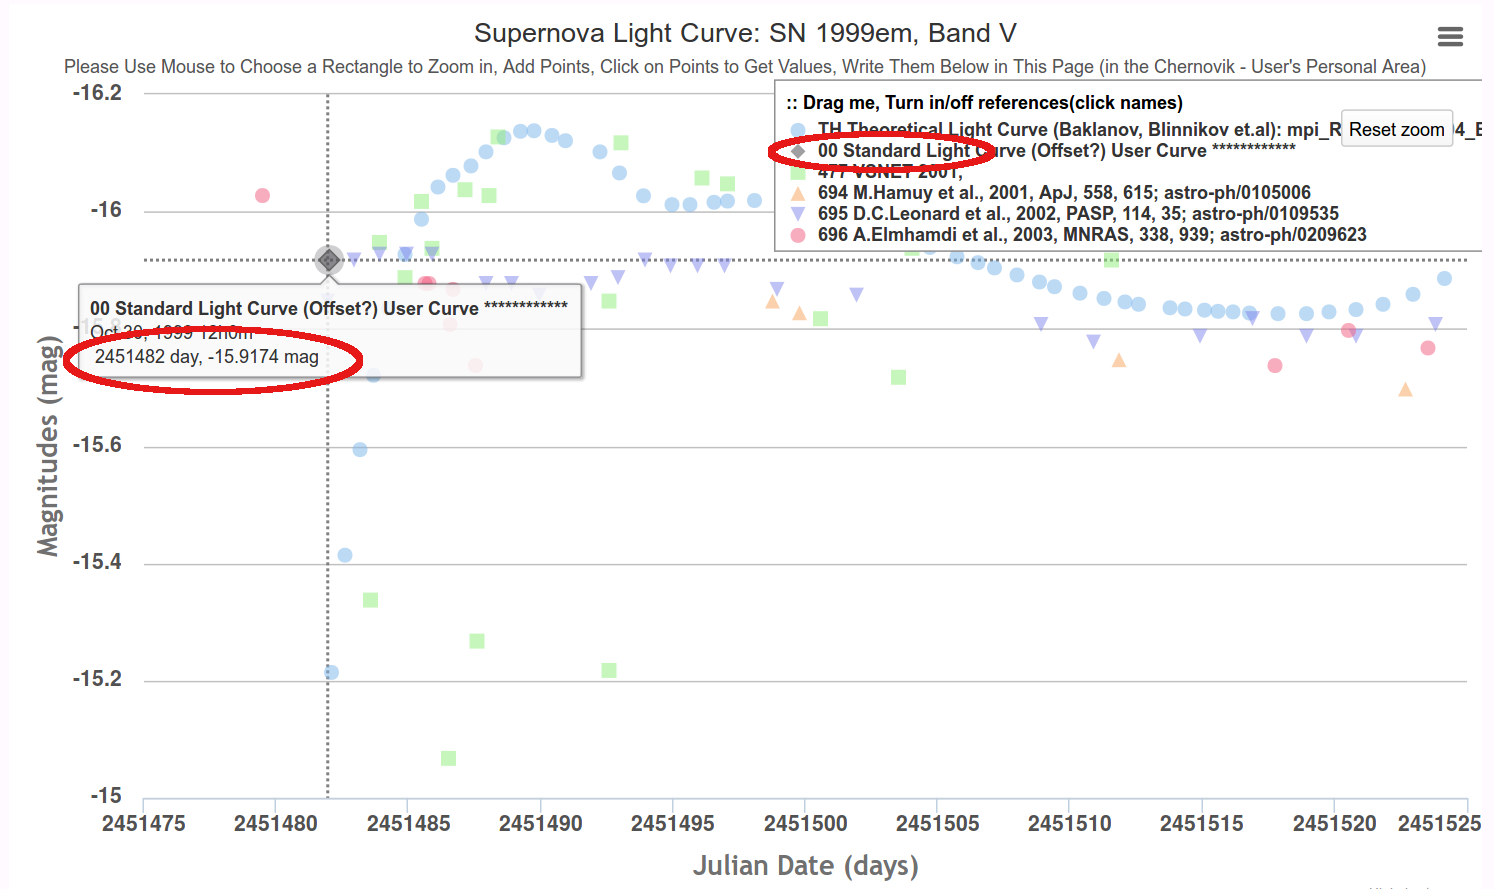 | |
| m) | *** The light curve peak point is marked with the red ellipse the mouse cursor 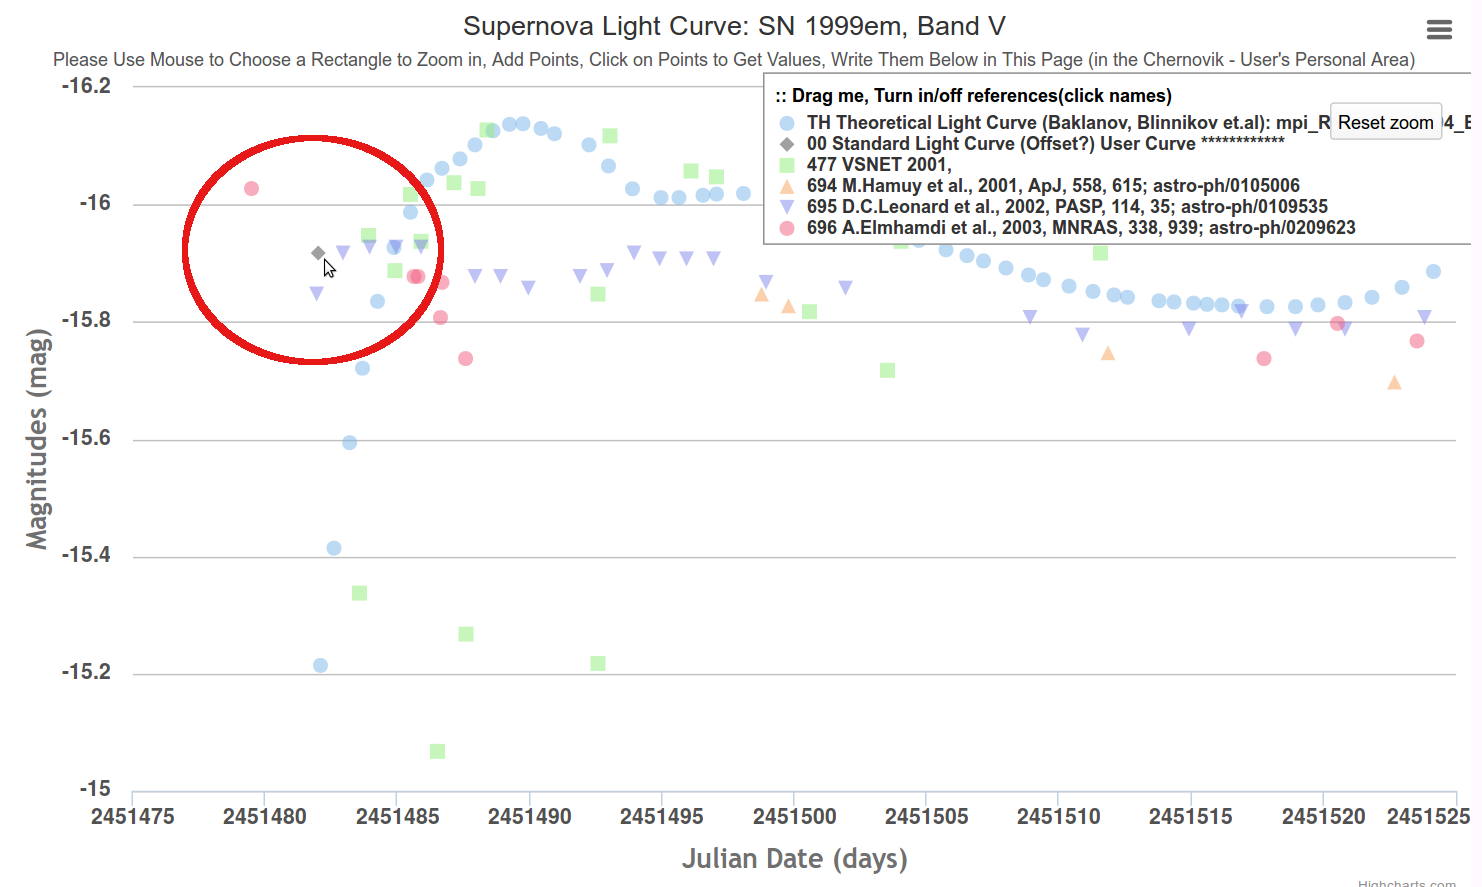 | |
| n) | *** While the peak of theoretical light curve is located at another place: *** 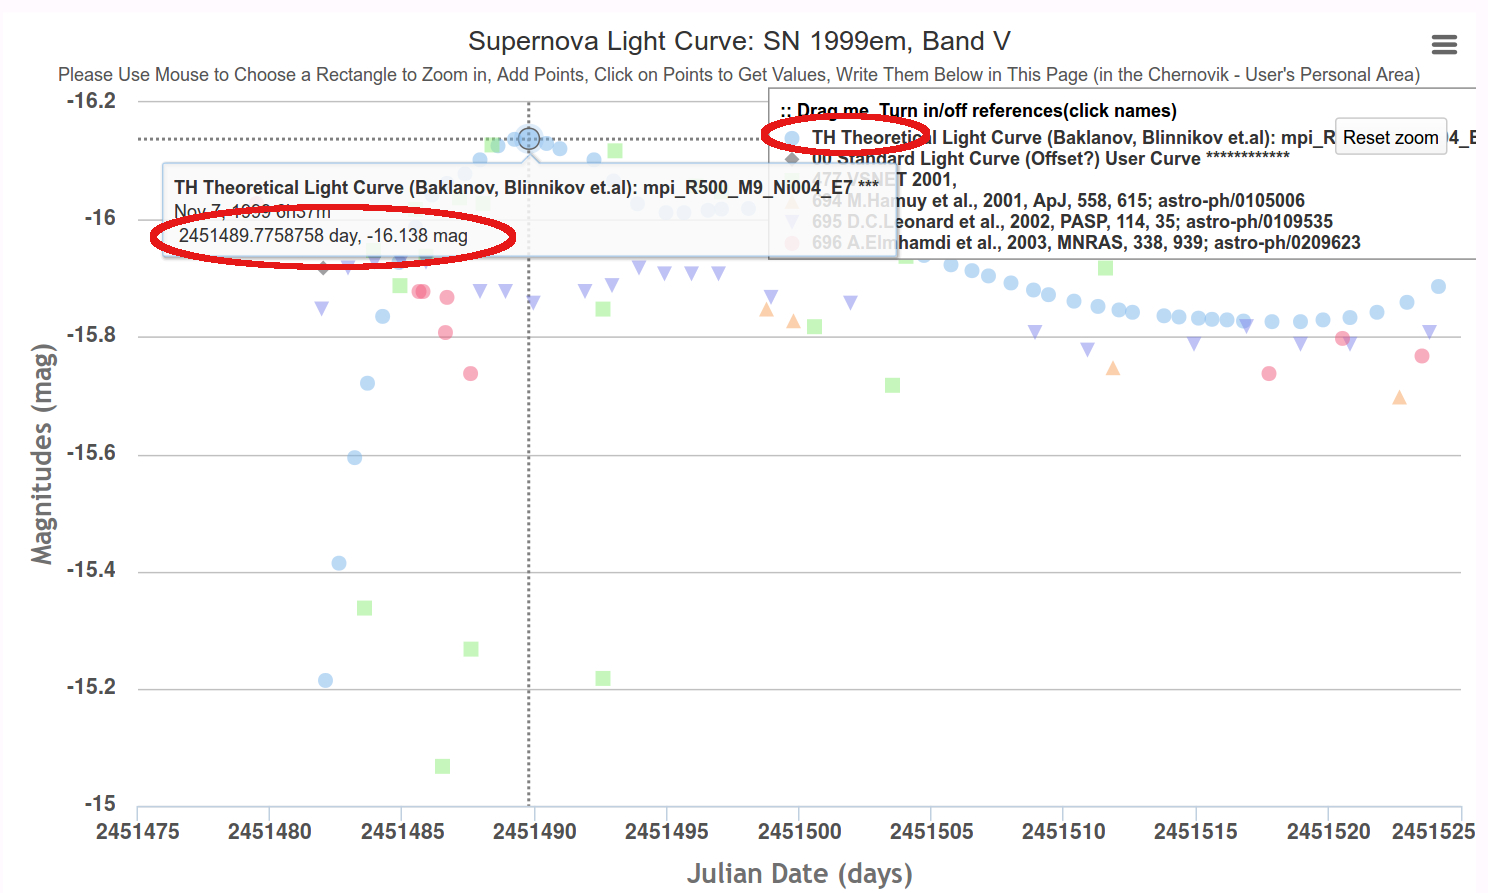 | |
| o) | *** So we shift theoretical light curve to the peak point of observable light curve: *** 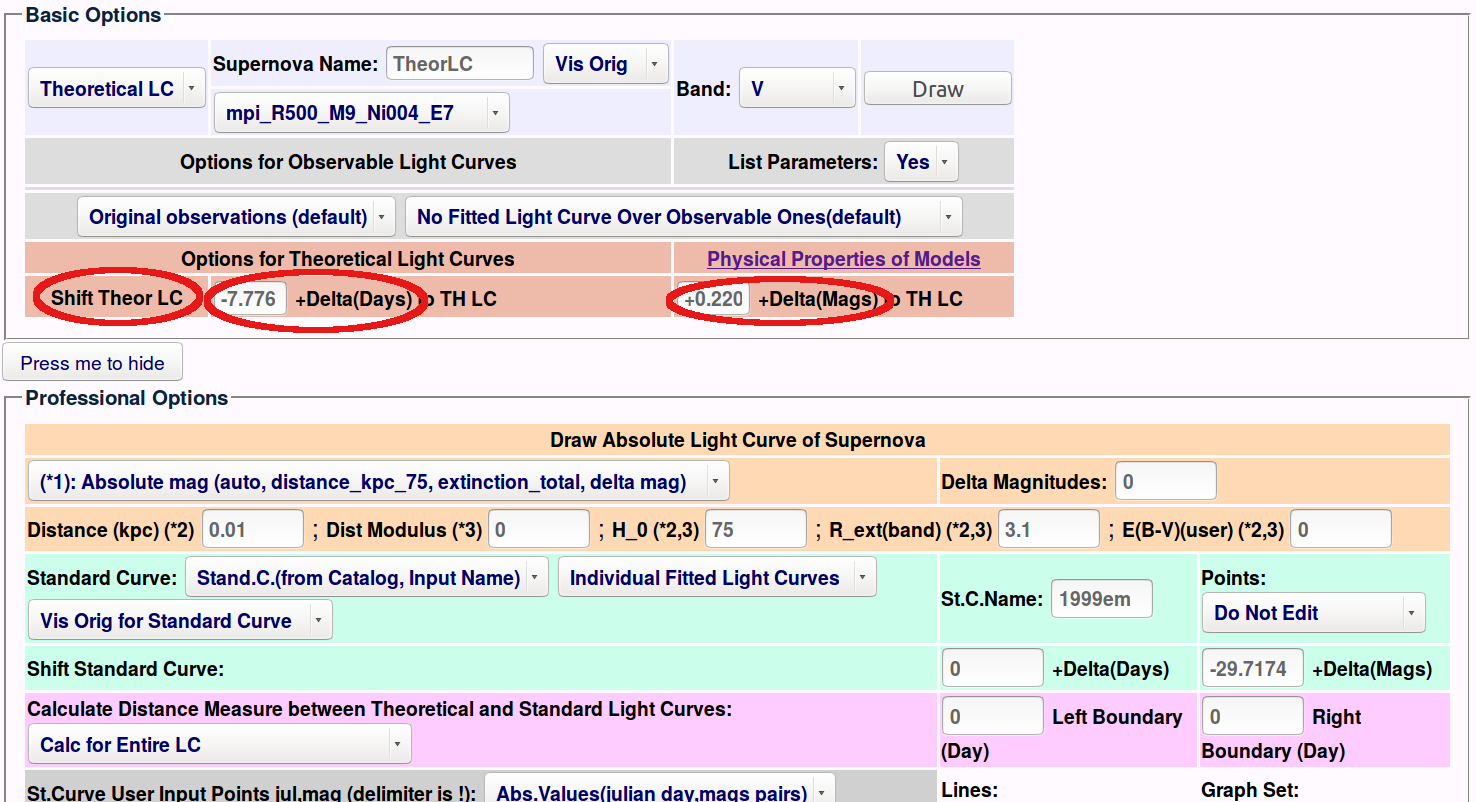 | |
| p) | *** In the case of observable light curve the result is the graph: *** < 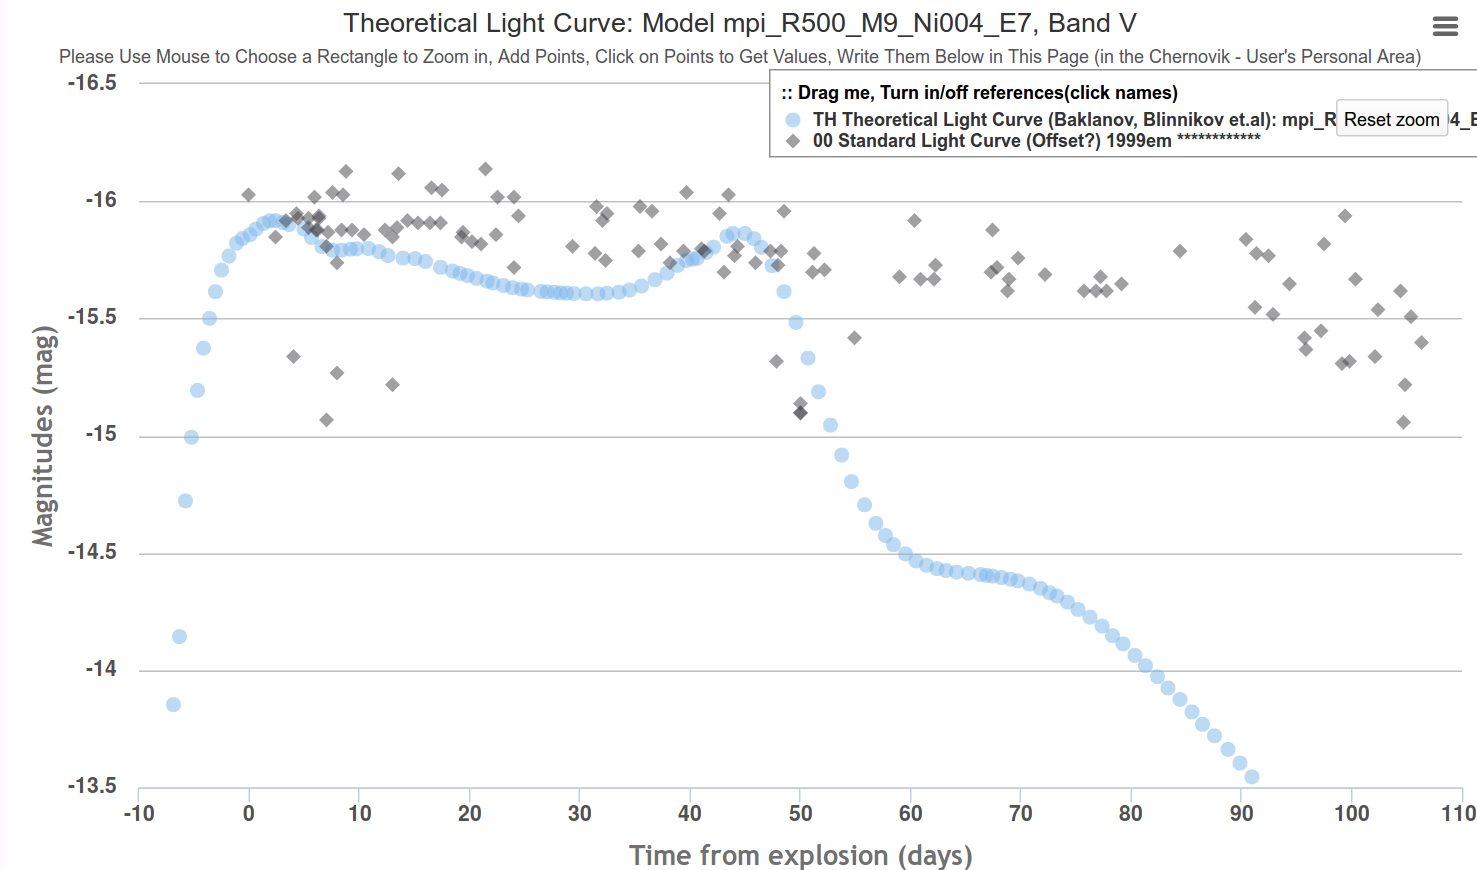 | |
| q) | *** And in the case of fitted light curve the result is: *** 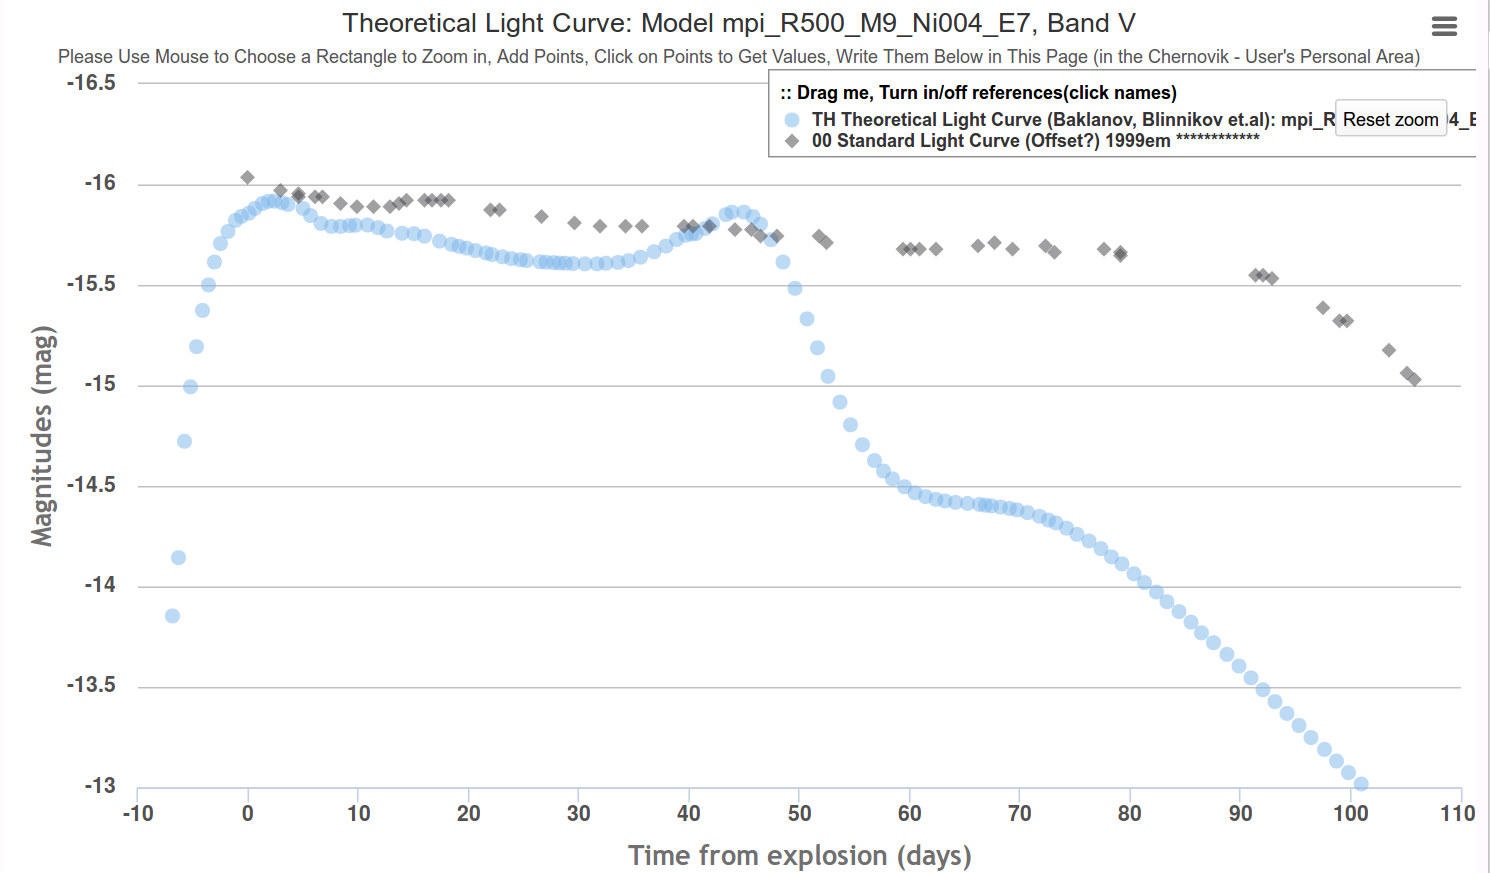 | |
| r) | *** Now we can calculate correct distance measure for whole standard light curve, as well as for its part between give left and right boundaries: *** 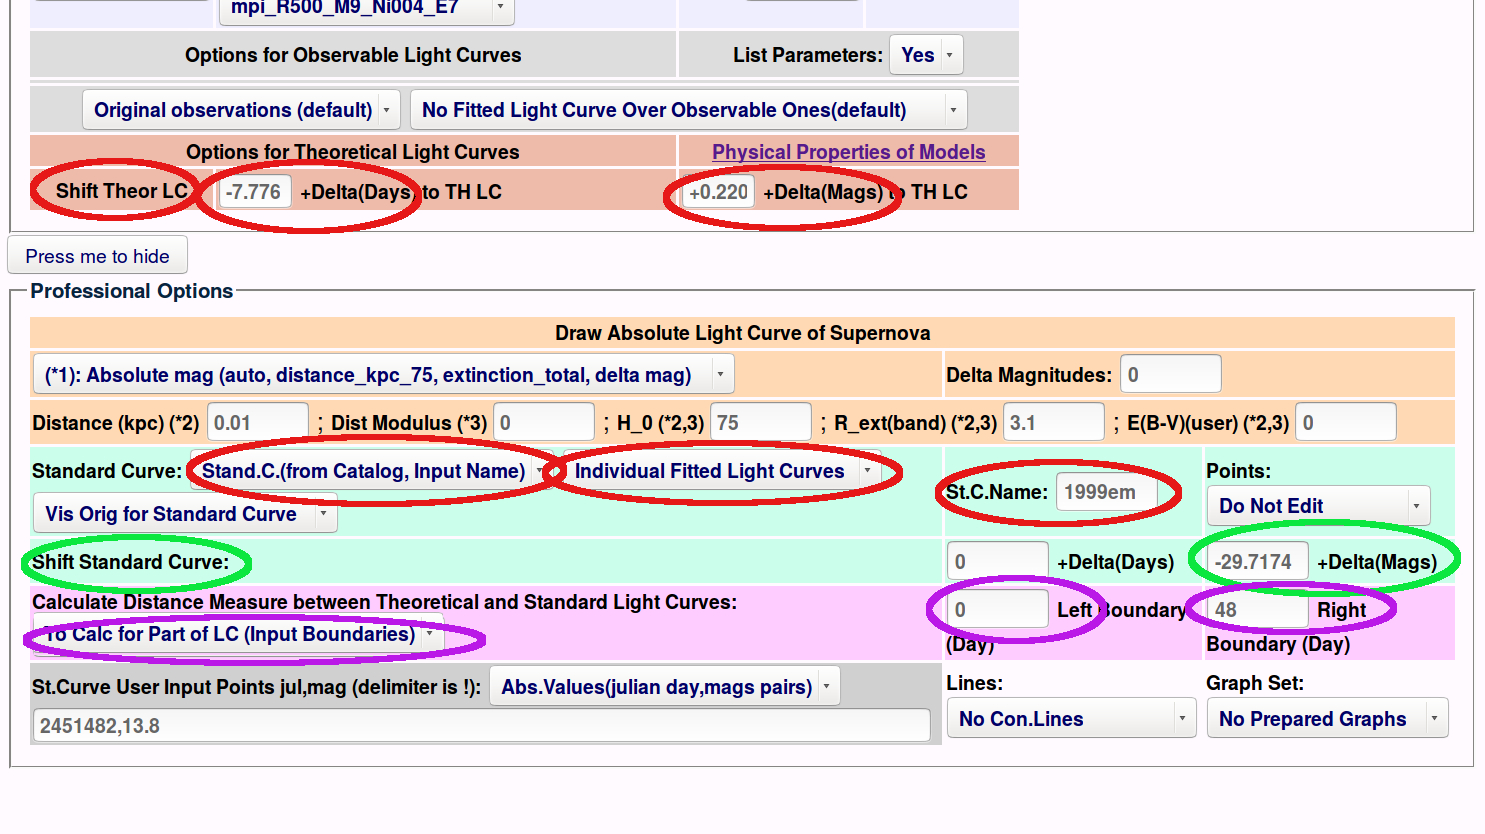 | |
| s) | *** For example calculation of the distance measure on the parts of curves between days 0 and 48 give next values: *** 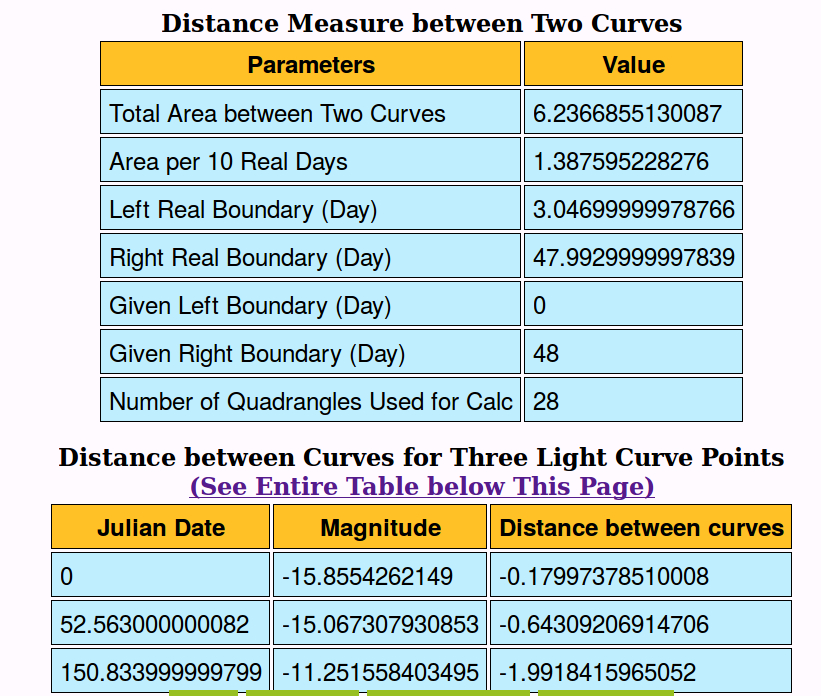 |